Climate Focus Survey 2017: Registered & Probable Oregon Voters
January, 2018
In September of 2017, PolicyInteractive surveyed 860 people who are registered to vote in Oregon (400 landline/cell phone; 460 internet) to see if Oregon’s probable voters agree with climate change science and if they support policy proposals that are designed to mitigate climate change. Of the 860 respondents, 27.7% were registered as Republicans and 40.9% as Democrats. New to this current study was a test of Oregon voter receptivity to policy reform on gas tax allocation. Below are some key findings from this survey. [Unabridged survey results: goo.gl/HfG3Mn]
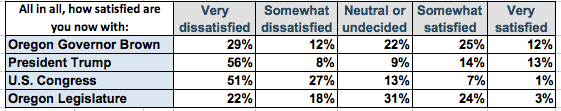
1. Satisfaction with politicians
Oregonians lean towards dissatisfaction with the way things are going in the U.S., with 18% satisfied and 75% dissatisfied, which is a bit less satisfied than that reported in Gallup’s national polls. This sample rates themselves as 27% satisfied and 63% dissatisfied with President Trump, 38% satisfied and 41% dissatisfied with Oregon Governor Brown, as well as 28% satisfied and 41% dissatisfied with the Oregon Legislature.
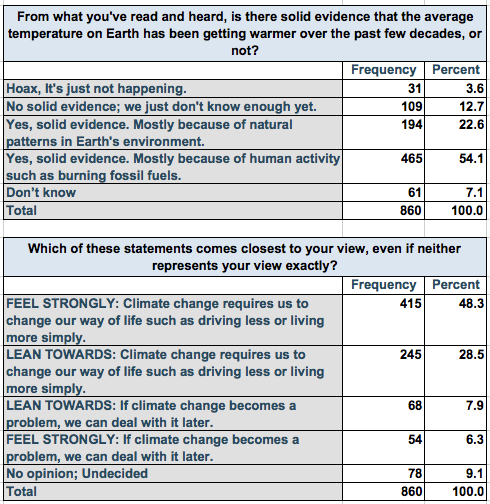
2. Climate change science
Results to the same question run in September 2015 show a very small increase in the acknowledgement that human behaviors are the main cause of climate change, with 4% responding “Hoax, it’s just not happening” and 54% responding “Yes, there is solid evidence…of human activity such as burning fossil fuels,” which is up 7% from the same question asked in 2015.
Of the Republicans surveyed, 22.3% agree with the scientific theory that there is solid evidence that climate change is happening, mostly because of human activity. Among the registered Democrats, 81.8% agree with this. Although only 22.3% of the sampled Republicans report that climate change is mostly human-caused, 56.6% agreed that climate change requires us to change our way of life, such as driving less or living more simply.
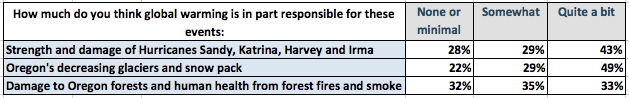
3. Evidence of global warming
Respondents were asked about evidence of the impacts of climate change found in natural events. This survey found 78% agreeing that Oregon’s decreasing glaciers and snowpack is caused by climate change, with lower but strong majorities in agreement that climate change is partially responsible for recent hurricanes and forest fires.
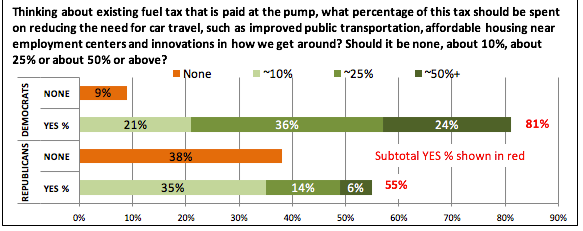
4. Allocation of fuel tax
In 1980, voters approved a state constitutional amendment that locked fuel tax spending exclusively to highways. The State of Oregon “Summary Report of Campaign Contributions and Expenditures” for the 1980 primary elections reveals that the majority of campaign contributions came from companies and agencies involved in building roads and highways, including the Asphalt Pavement Association of Oregon; several quarry, sand, and gravel companies; The Association of General Contractors of America; and The Highway Improvement Commission (ODOT). A majority of voters appear receptive to broadening fuel tax expenditures to include the funding of public transportation and affordable housing near employment centers and other innovations, with total registered voter support at 66%, 23% opposed and 10% undecided. Notably, a majority of Republican voters also favor redirecting some measure of highway funds at a 55% rate of support. (In figure below, “Undecided” not included.)
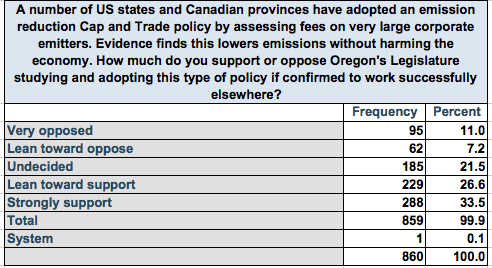
5. Cap and trade
Oregon voters support a cap and trade program similar to those enacted by California and Canadian Provinces more than 3:1, with 61% in support, 18% opposed, and 22% undecided. This question shows political party differences, with support from over 80% of Democrats, as compared to 35% support and 38% opposition from Republicans, and over 50% support from those registered as non-affiliated or with another party. These results are virtually unchanged from a similar question asked in 2015.
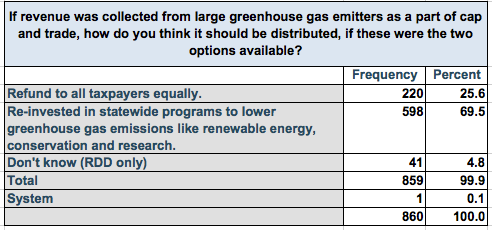
Reinvesting cap and trade policy revenue support at 3:1 over refunding revenue to citizens, 70% chose “Reinvestment in statewide programs to lower greenhouse gas emissions…” while 26% chose “Refunded to all taxpayers equally.” The refund option is being tested because it is a policy preference of the national group Citizens Climate Lobby, which has an active Oregon presence. These results are very close to the same question asked in 2015.
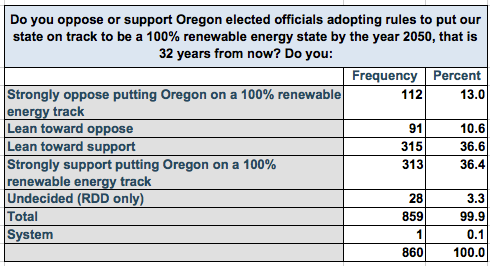
6. Get Oregon on track for 100% Renewable
Seventy four percent of voters support putting Oregon on a 100% renewable energy track by 2050, while 24% oppose this and only 3% undecided.
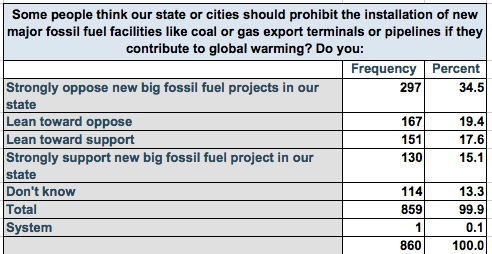
7. Installation of fossil fuel facilities
Fifty-four percent of sampled registered voters oppose big fossil fuel projects like coal or gas terminals with 33% in support and 13% undecided.
Demographics
Demographically, the survey was balanced geographically by Oregon’s five congressional districts, sampled to favor older ages to match voter participation, close to census gender balance, matched Oregon Republican voter registration but skewed slightly down on independent and high on Democrat registration, income cohort brackets skew low on low income, high on middle and high income but which trends toward voter participation characteristics; education levels of participants also skews low on lower education attainment and higher on upper education which also aligns with voter participation. See full unabridged for all questions and demographics.
Methodology
Survey designed and conducted by PolicyInteractive Research, Eugene, Oregon. This survey was in English and ran September 13 – September 25, 2017. Three primary respondent sources were used for this survey: 1) statistical sample random digit telephone split 50/50 land and mobile phones, interviewing by Information Alliance (IA) based in Logan, UT (N = 400); 2) internet non-statistical sample administered survey with addresses provided by ResearchNow, a full service marketing and research company based in Dallas, TX (N = 460); and 3) a national panel maintained by Amazon.com, Mechanical Turk (MTurk), used for comparative analysis, not included in this Oregon opinion sample. Telephone and internet sampling are both employed because telephone survey response rates have fallen precipitously in recent years and telephone respondents are known to be disproportionately older and more conservative than the general population, while internet sampling tends toward younger and more liberal respondents, providing a broader cross section of the general population. Sources 1 and 2 drew upon pre-screening for registered and likely voters rather than general population.
Telephone Source 1 drew the sample from a voter registration file obtained through the Oregon Secretary of State, from which thirty thousand voters who voted in either or both of the last two presidential elections were selected at random from the approximate 2 million Oregon registered voter list. The telephone sampling field house (IA) employed a CATI data file which drew from the 30,000 random list to obtain the final sampling. The telephone sample is calculated to provide a 4.9% margin of error at a 95% confidence level of Oregon frequent voters; a minimum of five minimum call attempts were specified to all working telephone numbers.
Internet Source 2 from ResearchNow (RN) pre-screened from their respondent lists for Oregon residents age 18 and above and registered to vote in Oregon. The RN internet sample was an opt-in and does not meet the qualifications to be a statistical sample.
It is well established that audio (telephone) and visual (internet) sampling yields different types of response characteristics, whereby audio yields higher response answering to first and last options if questions are in a multiple choice list.
PolicyInteractive adheres to the Standards of Practice of the American Association of Public Opinion Research and is a member of AAPOR’s Transparency Initiative.
Unabridged survey results: goo.gl/HfG3Mn
Comments, questions, inquiries: info@policyinteractive.org