Jordan Cove LNG (Jan/Feb 2018)
PolicyInteractive surveyed 1115 Oregon voters within all five congressional districts to assess public opinion on the Jordan Cove LNG (liquefied natural gas) terminal proposed to be built in Coos Bay, Oregon. Little support is found among Oregonians, regardless of within which congressional district they reside– more support emerged overall among Oregonians who tend to vote for Republican candidates.
Oregon is divided into five congressional districts, some more rural than others. Exploring public opinion by way of congressional district is a way to give voice to voters who live in more rural locations. As seen in the map below, District 1 includes the northwest corner of Oregon, District 2 represents the eastern side and Medford, District 3 includes most of Portland, District 4 includes the Eugene/Springfield area and several coastal towns (including the Jordan Cove’s proposed building location of Coos Bay), and District 5 includes the Salem/Kaiser area as well some coastal towns.

Congressional districts show little support
Among those surveyed within Congressional District 4, in which the terminal would be built, 8% report strongly supporting the Jordan Cove project and 18% lean towards supporting the project. District 3 reveals the strongest opposition, with 37% strongly opposing and 30% leaning towards opposing the project, which is no big surprise considering this district includes liberal-leaning Portland. (In graph below, red and pink bars represent opposition to the project, grey represents undecided or neutral, and dark and light green bars represent support for the Jordan Cove LNG terminal.) 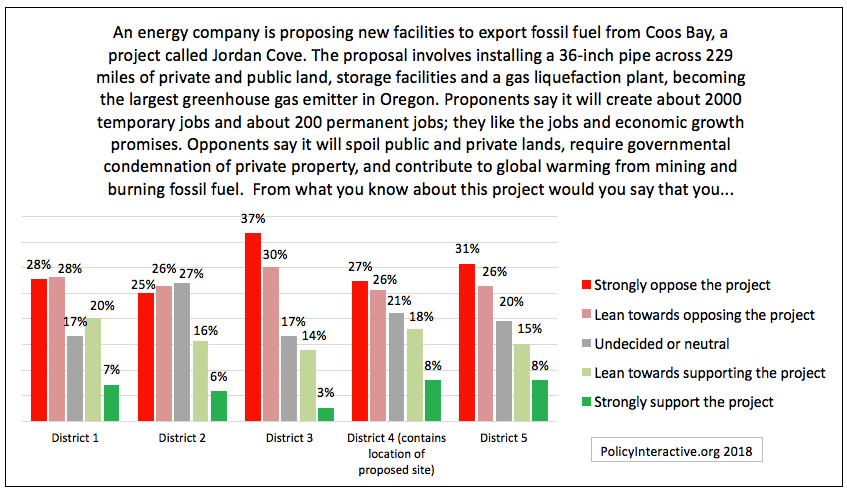
Although the strongest support was found in District 4, only 37% of those surveyed within the fourth district chose the statement “It is desirable because of jobs and economic growth,” with 63% choosing “It is undesirable because of private property rights and environmental impacts.” (In graph below, green bars represent support because of economic reasons and red bars represent opposition because of the effects on private property and the environment.)
Most support from those who vote Republican
Those surveyed were asked if they tend to vote more for Republican or Democrat candidates, with 35% choosing Republicans (n = 385), 47% Democrats (n = 523), and 19% neither (n = 207).
Those who identify more with the Republican party were the most likely to support the Jordan Cove LNG proposal, with 14% strongly in support and 31% leaning towards support. (In graph below, red and pink bars represent opposition to the project, grey represents undecided or neutral, and dark and light green bars represent support for the Jordan Cove LNG terminal.)
Among those who identify with the Republican party, 57% of those surveyed chose the statement “It is desirable because of jobs and economic growth,” with 43% choosing “It is undesirable because of private property rights and environmental impacts.” Those who most often vote Democrat and those who avoid both political parties made clear their opposition to the Jordan Cove proposal, with 86% and 76% in opposition. (In graph below, green bars represent support because of economic reasons and red bars represent opposition because of the effects on private property and the environment.)
Methodology
This online survey was designed and conducted by PolicyInteractive Research (PI), located in Eugene, Oregon. This is a non-statistical sample because it employs opt-in internet sampling. Two sources of respondent audiences were employed: Mechanical Turk (147 Oregon voters) and ResearchNow (968 Oregon voters). Both survey sources provided a token monetary reward of approximately one dollar to each participant for taking the survey. This survey was administered in English, across the dates January 30-February 5, 2018. Data is weighted by congressional district to give equal voice to harder-to-reach voters.
