Do different voting systems lead to different winners?
June 2017, Robin Quirke
Some voting experts assert that an alternative voting system, as opposed to the current plurality voting system, would more honestly reflect the will of the people in political elections. Focusing on the presidential election of 2016, PolicyInteractive conducted three sequential studies which together explored the question: do election results vary depending on which voting system is used?
Using electronic mock ballots, participants voted for their preferred candidate using the standard U.S. voting system of plurality, along with three championed alternatives: approval voting, score voting, and instant runoff voting (chart with pros and cons here)
See below for key findings, methodology and full results. (Note: This study used nonprobability sampling; see explanation below.)
Mock Ballot Results
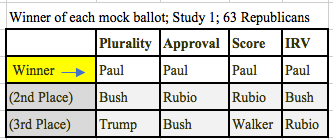
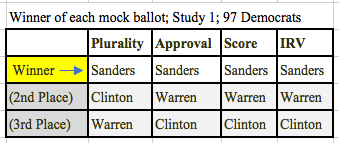
Study 1 (July 2015, 63 Republicans, 97 Democrats)
Based on the most popular candidates running in the primaries at the time, Republican mock ballot candidate choices included Ted Cruz, Scott Walker, Rick Santorum, Donald Trump, Rand Paul, Chris Christie, Rick Perry, Marco Rubio, Jeb Bush, and Mike Huckabee; Democratic mock ballot candidate choices included Jim Webb, Hilary Clinton, Lincoln Chafee, Bernie Sanders, and Elizabeth Warren; and third party candidates included Derrick Reid, Ed Baker, Cynthia McKinney, Jill Stein, Ryan Shepard, and Darryl Perry (all mock ballot candidate lists were randomized).
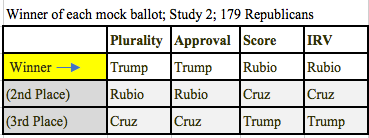
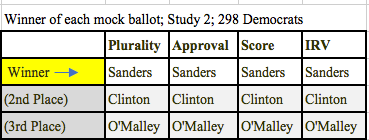
Study 2 (January 2016, 179 Republicans, 298 Democrats)
By the time of this survey, some presidential candidates had dropped out, so the mock ballots had fewer candidates listed. Republican mock ballot candidate choices included Jeb Bush, Ben Carson, Ted Cruz, Marco Rubio, and Donald Trump; Democratic mock ballot candidate choices included Hilary Clinton, Martin O’Malley, and Bernie Sanders; green party candidates included Jill Stein; independent candidates included Ed Baker and Mike Bloomburg; and Libertarians included Darryl Perry and Derrick Reid (all mock ballot candidate lists were alphabetized)
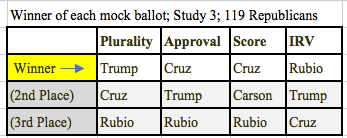
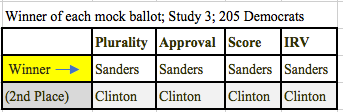
Study 3 (March 2016, 119 Republicans, 205 Democrats)
For Study 3, each participant was asked how they are registered to vote, and then routed to their respective party’s mock ballots. Based on who was left in the race, Republican mock ballot candidate choices included Ben Carson, Ted Cruz, John Kasich, Marco Rubio, and Donald Trump; Democrat mock ballot candidate choices included Hilary Clinton and Bernie Sanders; third party candidates included all of the Republican and Democratic candidates along with Ed Baker, Mike Bloomburg, Darryl Perry, Derrick Reid, and Jill Stein (Republican and Democrat mock ballot candidate lists were alphabetized, third party candidate lists were organized by party and then alphabetized).
Plurality voting systems is ineffective in capturing voter dislike of candidates
As made apparent by these three studies, changing a voting system does not always effect the resulting winner, but the results for the Republican mock election for Study 3 illustrates how it is possible. For Study 3, Trump won only when the plurality voting system was used, Cruz won when approval and score voting systems were used, and Rubio won under the IRV system. As mentioned above, with plurality voting, Trump was the winner with a relative majority of 38 votes, and although 38 people prefer Trump, 81 do not (8 voted for Carson, 15 for Kasich, 21 for Rubio, 32 for Cruz, and 5 for various write-ins). This inability to capture the strength of voter dislike for a particular candidate when there are more than two candidates is one of the reasons the plurality voting system is deemed unrepresentative of the voting majority.
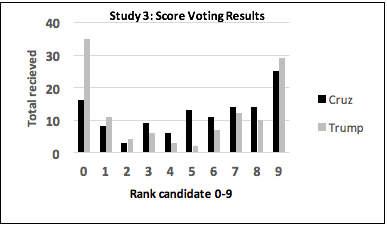
The bar graph directly above further illustrates this point, displaying how Republicans rated Trump and Cruz on a scale from 0-9 (with 0 being the least favorable score and 9 being the most favorable score a candidate can receive). Trump (gray bars) received more favorable scores of nine (highest score a candidate can receive) than Cruz (black bars), but the low end of the 0-9 scale also reveals that Trump received proportionally more unfavorable scores of zero than Cruz. Trump individually had more lowest score (zero) selections than highest score (nine) selections. Trump is the “exclusive” candidate, eliciting extreme responses, and Cruz the “inclusive” candidate with a more moderate level of support, but from a broader scope of voters (Balinski & Laraki, 2007). It is important to note the plurality voting system was not capable of capturing the absolute majority of voters who disliked Trump in this sample.
Methodology & Transparency
These three surveys were collected via opt-in online survey among five nonprobability samples, each consisting of Americans, 18 years of age or older. The first survey was collected in July 2015 (N = 204), the second survey was collected in January 2016 (N = 615), and the third was collected in March 2016 (N = 446). These three surveys were chosen because they were diverse in their results.
This study was sponsored, conducted, and funded by PolicyInteractive. These samples were acquired through Mechanical Turk. Respondents were paid a token of $.25 each. The reported data is not weighted. These surveys were administered in English.
Contact us at info@policyinteractive.org for data of any or all of the five samples collected.